"Clean Market Structure & Trend Confirmation" Clean Market Structure & Trend Confirmation is a high-probability Market Structure and Trend Confirmation indicator trading system designed specifically for SPY and QQQ.
It combines trend structure, multi-timeframe confirmation, momentum gating, and market-state filtering to deliver clean, disciplined BUY and SELL signals — without noise, chop, or over-trading.
This script is built for traders who want clarity first, execution second.
חפש סקריפטים עבור "Buy sell"

Simple Candle Strategy# Candle Pattern Strategy - Pine Script V6
## Overview
A TradingView trading strategy script (Pine Script V6) that identifies candlestick patterns over a configurable lookback period and generates trading signals based on pattern recognition rules.
## Strategy Logic
The strategy analyzes the most recent N candlesticks (default: 5) and classifies their patterns into three categories, then generates buy/sell signals based on specific pattern combinations.
### Candlestick Pattern Classification
Each candlestick is classified as one of three types:
| Pattern | Definition | Formula |
|---------|-----------|---------|
| **Close at High** | Close price near the highest price of the candle | `(high - close) / (high - low) ≤ (1 - threshold)` |
| **Close at Low** | Close price near the lowest price of the candle | `(close - low) / (high - low) ≤ (1 - threshold)` |
| **Doji** | Opening and closing prices very close; long upper/lower wicks | `abs(close - open) / (high - low) ≤ threshold` |
### Trading Rules
| Condition | Action | Signal |
|-----------|--------|--------|
| Number of Doji candles ≥ 3 | **SKIP** - Market is too chaotic | No trade |
| "Close at High" count ≥ 2 + Last candle closes at high | **LONG** - Bullish confirmation | Buy Signal |
| "Close at Low" count ≥ 2 + Last candle closes at low | **SHORT** - Bearish confirmation | Sell Signal |
## Configuration Parameters
All parameters are adjustable in TradingView's "Settings/Inputs" tab:
| Parameter | Default | Range | Description |
|-----------|---------|-------|-------------|
| **K-line Lookback Period** | 5 | 3-20 | Number of candlesticks to analyze |
| **Doji Threshold** | 0.1 | 0.0-1.0 | Body size / Total range ratio for doji identification |
| **Doji Count Limit** | 3 | 1-10 | Number of dojis that triggers skip signal |
| **Close at High Proximity** | 0.9 | 0.5-1.0 | Required proximity to highest price (0.9 = 90%) |
| **Close at Low Proximity** | 0.9 | 0.5-1.0 | Required proximity to lowest price (0.9 = 90%) |
### Parameter Tuning Guide
#### Proximity Thresholds (Close at High/Low)
- **0.95 or higher**: Stricter - only very strong candles qualify
- **0.90 (default)**: Balanced - good for most market conditions
- **0.80 or lower**: Looser - catches more patterns, higher false signals
#### Doji Threshold
- **0.05-0.10**: Strict doji identification
- **0.10-0.15**: Standard doji detection
- **0.15+**: Includes near-doji patterns
#### Lookback Period
- **3-5 bars**: Fast, sensitive to recent patterns
- **5-10 bars**: Balanced approach
- **10-20 bars**: Slower, filters out noise
## Visual Indicators
### Chart Markers
- **Green Up Arrow** ▲: Long entry signal triggered
- **Red Down Arrow** ▼: Short entry signal triggered
- **Gray X**: Skip signal (too many dojis detected)
### Statistics Table
Located at top-right corner, displays real-time pattern counts:
- **Close at High**: Count of candles closing near the high
- **Close at Low**: Count of candles closing near the low
- **Doji**: Count of doji/near-doji patterns
### Signal Labels
- Green label: "✓ Long condition met" - below entry bar
- Red label: "✓ Short condition met" - above entry bar
- Gray label: "⊠ Too many dojis, skip" - trade skipped
## Risk Management
### Exit Strategy
The strategy includes built-in exit rules based on ATR (Average True Range):
- **Stop Loss**: ATR × 2
- **Take Profit**: ATR × 3
Example: If ATR is $10, stop loss is at -$20 and take profit is at +$30
### Position Sizing
Default: 100% of equity per trade (adjustable in strategy properties)
**Recommendation**: Reduce to 10-25% of equity for safer capital allocation
## How to Use
### 1. Copy the Script
1. Open TradingView
2. Go to Pine Script Editor
3. Create a new indicator
4. Copy the entire `candle_pattern_strategy.pine` content
5. Click "Add to Chart"
### 2. Apply to Chart
- Select your preferred timeframe (1m, 5m, 15m, 1h, 4h, 1d)
- Choose a trading symbol (stocks, forex, crypto, etc.)
- The strategy will generate signals on all historical bars and in real-time
### 3. Configure Parameters
1. Right-click the strategy on chart → "Settings"
2. Adjust parameters in the "Inputs" tab
3. Strategy will recalculate automatically
4. Backtest results appear in the Strategy Tester panel
### 4. Backtesting
1. Click "Strategy Tester" (bottom panel)
2. Set date range for historical testing
3. Review performance metrics:
- Win rate
- Profit factor
- Drawdown
- Total returns
## Key Features
✅ **Execution Model Compliant** - Follows official Pine Script V6 standards
✅ **Global Scope** - All historical references in global scope for consistency
✅ **Adjustable Sensitivity** - Fine-tune all pattern detection thresholds
✅ **Real-time Updates** - Works on both historical and real-time bars
✅ **Visual Feedback** - Clear signals with labels and statistics table
✅ **Risk Management** - Built-in ATR-based stop loss and take profit
✅ **No Repainting** - Signals remain consistent after bar closes
## Important Notes
### Before Trading Live
1. **Backtest thoroughly**: Test on at least 6-12 months of historical data
2. **Paper trading first**: Practice with simulated trades
3. **Optimize parameters**: Find the best settings for your trading instrument
4. **Manage risk**: Never risk more than 1-2% per trade
5. **Monitor performance**: Review trades regularly and adjust as needed
### Market Conditions
The strategy works best in:
- Trending markets with clear directional bias
- Range-bound markets with defined support/resistance
- Markets with moderate volatility
The strategy may underperform in:
- Highly choppy/noisy markets (many false signals)
- Markets with gaps or overnight gaps
- Low liquidity periods
### Limitations
- Works on chart timeframes only (not intrabar analysis)
- Requires at least 5 bars of history (configurable)
- Fixed exit rules may not suit all trading styles
- No trend filtering (will trade both directions)
## Technical Details
### Historical Buffer Management
The strategy declares maximum bars back to ensure enough historical data:
```pine
max_bars_back(close, 20)
max_bars_back(open, 20)
max_bars_back(high, 20)
max_bars_back(low, 20)
```
This prevents runtime errors when accessing historical candlestick data.
### Pattern Detection Algorithm
```
For each bar in lookback period:
1. Calculate (high - close) / (high - low) → close_to_high_ratio
2. If close_to_high_ratio ≤ (1 - threshold) → count as "Close at High"
3. Calculate (close - low) / (high - low) → close_to_low_ratio
4. If close_to_low_ratio ≤ (1 - threshold) → count as "Close at Low"
5. Calculate abs(close - open) / (high - low) → body_ratio
6. If body_ratio ≤ doji_threshold → count as "Doji"
Signal Generation:
7. If doji_count ≥ cross_count_limit → SKIP_SIGNAL
8. If close_at_high_count ≥ 2 AND last_close_at_high → LONG_SIGNAL
9. If close_at_low_count ≥ 2 AND last_close_at_low → SHORT_SIGNAL
```
## Example Scenarios
### Scenario 1: Bullish Signal
```
Last 5 bars pattern:
Bar 1: Closes at high (95%) ✓
Bar 2: Closes at high (92%) ✓
Bar 3: Closes at mid (50%)
Bar 4: Closes at low (10%)
Bar 5: Closes at high (96%) ✓ (last bar)
Result:
- Close at high count: 3 (≥ 2) ✓
- Last closes at high: ✓
- Doji count: 0 (< 3) ✓
→ LONG SIGNAL ✓
```
### Scenario 2: Skip Signal
```
Last 5 bars pattern:
Bar 1: Doji pattern ✓
Bar 2: Doji pattern ✓
Bar 3: Closes at mid
Bar 4: Doji pattern ✓
Bar 5: Closes at high
Result:
- Doji count: 3 (≥ 3)
→ SKIP SIGNAL - Market too chaotic
```
## Performance Optimization
### Tips for Better Results
1. **Use Higher Timeframes**: 15m or higher reduces false signals
2. **Combine with Indicators**: Add volume or trend filters
3. **Seasonal Adjustment**: Different parameters for different seasons
4. **Instrument Selection**: Test on liquid, high-volume instruments
5. **Regular Rebalancing**: Adjust parameters quarterly based on performance
## Troubleshooting
### No Signals Generated
- Check if lookback period is too large
- Verify proximity thresholds aren't too strict (try 0.85 instead of 0.95)
- Ensure doji limit allows for trading (try 4-5 instead of 3)
### Too Many False Signals
- Increase proximity thresholds to 0.95+
- Reduce lookback period to 3-4 bars
- Increase doji limit to 3-4
- Test on higher timeframes
### Strategy Tester Shows Losses
- Review individual trades to identify patterns
- Adjust stop loss and take profit ratios
- Change lookback period and thresholds
- Test on different market conditions
## References
- (www.tradingview.com)
- (www.tradingview.com)
- (www.investopedia.com)
- (www.investopedia.com)
## Disclaimer
**This strategy is provided for educational and research purposes only.**
- Not financial advice
- Past performance does not guarantee future results
- Always conduct thorough backtesting before live trading
- Trading involves significant risk of loss
- Use proper risk management and position sizing
## License
Created: December 15, 2025
Version: 1.0
---
**For updates and modifications, refer to the accompanying documentation files.**

SUPERTREND VALIDADO ADX EMAS VWAP # Modular Trading System - SuperTrend + ADX + Multi-Filter Confirmation
## Overview
Professional modular trading system designed for trend-following strategies on 4H timeframes. Features a clean, mobile-optimized interface with customizable filters and real-time status monitoring.
## Core Features
### Validated Components (Backtested)
- **SuperTrend (ATR 10, Multiplier 3.0)**: Primary trend direction filter with visual fill
- **ADX >23**: Trend strength confirmation (14-period)
- Proven performance: 52.11% win rate, 3.162 profit factor over 4 years
### Additional Filters (Optional)
- **DI Spread >9**: Directional movement confirmation
- **Volume > EMA20**: Volume confirmation above 20-period average
- **EMA System**: 7/21/50 with dynamic coloring
- **VWAP**: Daily volume-weighted average price
### Visual Elements
- **SuperTrend Line**: Green (bullish) / Red (bearish) with background fill
- **EMA 7**: Yellow when ADX >23, White when ADX ≤23
- **EMA 21**: Green (price above) / Red (price below)
- **EMA 50**: Blue reference line
- **VWAP**: Orange line
- **PDH/PDL**: Previous day high/low levels
- **EMA Cross Signals**: Small dots marking 7/21 crossovers
### Smart Money Concepts
- Automatic Previous Day High (PDH) / Previous Day Low (PDL) tracking
- Horizontal lines extending from current price
- Clear labeling for support/resistance levels
## Status Dashboard
Compact 2-column table (top-right) shows:
```
FILTERS | STATUS
1. ADX >23 | 47.6 OK / 18.2 NO
2. DI Spread >9 | Bullish / Bearish
3. SuperTrend | Bullish / Bearish
4. Volume >EMA20 | 1.25x OK / 0.14x NO
─────────────────────────────
SIGNAL | BUY / SELL / WAIT
```
Color-coded backgrounds:
- Green: Condition met
- Red: Condition not met
- Yellow: Waiting for confirmation
## Signal Logic
### Entry Conditions
**LONG**: All active filters must align
- SuperTrend bullish (green)
- ADX >23
- DI+ > DI- (if DI Spread enabled)
- Volume > EMA20 (if Volume enabled)
- Price > EMA21 and EMA7 > EMA21 (if EMAs enabled)
**SHORT**: All active filters must align
- SuperTrend bearish (red)
- ADX >23
- DI- > DI+ (if DI Spread enabled)
- Volume > EMA20 (if Volume enabled)
- Price < EMA21 and EMA7 < EMA21 (if EMAs enabled)
### Exit Conditions
- SuperTrend direction change
- Clear "EXIT" markers on chart
### Position Management
- One position per trend (no pyramiding)
- Prevents multiple entries in same direction
- "WAIT" status when conditions partially met
## Settings & Customization
### Filters (Enable/Disable)
**Core Filters:**
- ✓ SuperTrend (VALIDATED)
- ✓ ADX >23 (VALIDATED)
**Additional Filters:**
- ⚠️ DI Spread >9 (EXPERIMENTAL)
- ⚠️ Volume > EMA20 (EXPERIMENTAL)
- ⚠️ EMAs 7/21/50 (EXPERIMENTAL)
**Visual:**
- Show EMA 7/21 Crosses (dots)
### Parameters
**SuperTrend:**
- ATR Period: 10 (default)
- ATR Multiplier: 3.0 (default)
**ADX/DI:**
- ADX Length: 14 (default)
- ADX Threshold: 23 (default)
- DI Spread Threshold: 9 (default)
**Volume:**
- Volume EMA: 20 (default)
**EMAs:**
- Fast EMA: 7 (default)
- Medium EMA: 21 (default)
- Slow EMA: 50 (default)
## Alerts
Pre-configured alerts for:
- Long Signal (BUY - Entry confirmed)
- Short Signal (SELL - Entry confirmed)
- Exit Long (EXIT LONG - SuperTrend changed)
- Exit Short (EXIT SHORT - SuperTrend changed)
- EMA Cross Up (EMA 7 crossed above EMA 21)
- EMA Cross Down (EMA 7 crossed below EMA 21)
## Best Practices
### Recommended Setup (Validated System)
```
Enable ONLY:
- SuperTrend: ON
- ADX >23: ON
- All other filters: OFF
```
### Testing New Filters
1. Enable experimental filters
2. Backtest thoroughly before live trading
3. Compare performance metrics
4. Validate with demo account first
### Timeframe
- Optimized for: 4H charts
- Tested on: Bitcoin/USDT
- Works on: Any trending instrument
## Risk Management
This indicator provides entry/exit signals but does NOT include:
- Stop loss levels
- Take profit targets
- Position sizing
Always use proper risk management:
- Maximum 1-2% risk per trade
- Use stop losses
- Follow your trading plan
## Performance Notes
**Validated Backtest Results (SuperTrend + ADX only):**
- Win Rate: 52.11%
- Profit Factor: 3.162
- Return: +45.46% (4 years)
- Tested Period: 2020-2024
- Instrument: BTC/USDT 4H
**Important:** Adding additional filters changes the system. Results may vary. Always backtest your specific configuration before live trading.
## Mobile Optimization
- Compact table design
- Clear color coding
- Minimal chart clutter
- Large signal text
- Optimized for small screens
## Use Cases
✅ **Ideal for:**
- Trend-following strategies
- Swing trading (4H timeframe)
- Clear market conditions
- Systematic traders
❌ **NOT ideal for:**
- Scalping (too slow)
- Range-bound markets
- Counter-trend strategies
- Lateral/choppy conditions
## Credits & Methodology
Based on proven technical analysis principles:
- SuperTrend (volatility-based trend following)
- ADX (trend strength measurement)
- Directional Indicators (DI+/DI-)
- Volume analysis
- EMA systems
**Designed for:** Disciplined execution over frequent trading
**Philosophy:** Quality setups > Quantity of trades
## Disclaimer
This indicator is for educational purposes only. Past performance does not guarantee future results. Always:
- Test on demo account first
- Use proper risk management
- Never risk more than you can afford to lose
- Consult a financial advisor
Trading involves substantial risk. This tool does not constitute financial advice.
---
## Version History
**v2.0 (Current)**
- Modular filter system
- 2-column compact status table
- EMA 7 dynamic coloring (yellow when ADX >23)
- EMA 50 + VWAP added
- PDH/PDL levels
- EMA cross markers
- Improved signal logic
- One position per trend
- Multiple alert conditions
---
**For support, updates, or feedback, contact the developer.**

SUPERTREND ADX FACTOR Modular Trading System - SuperTrend + ADX + DI
A comprehensive trend-following system with customizable filters for precise trade execution.
CORE COMPONENTS:
- SuperTrend with visual fill (trend detection)
- ADX + Directional Indicators (trend strength confirmation)
- Volume filter (optional)
- EMAs 7/21/50 (optional)
- Daily VWAP (optional)
- Previous Day High/Low levels (support/resistance)
KEY FEATURES:
✓ One entry per trend - avoids overtrading
✓ Entry: ADX crosses above threshold with SuperTrend alignment
✓ Exit: SuperTrend direction change
✓ Real-time status dashboard showing all filter conditions
✓ Clear BUY/SELL signals with EXIT markers
✓ All filters can be toggled ON/OFF for testing
✓ Customizable parameters for each indicator
DASHBOARD DISPLAY:
- Live ADX value (green >23 / red <23)
- DI+/DI- values with color coding
- Volume metrics
- Position status (IN/OUT)
- Signal status (BUY/SELL/WAIT)
IDEAL FOR:
Swing traders and position traders on 4H timeframe looking for high-probability trend entries with proper confirmation.
Default configuration: SuperTrend (ATR 10, 3.0) + ADX >23 + DI alignment

ORB Strategy + Backtesting (fixed timestamp) - Lines Adjusted⚡ ORB Strategy + Backtesting (Pine Script v5)
This script implements a complete Opening Range Breakout (ORB) strategy, featuring built-in backtesting, advanced TP/SL visualization, full style customization, and a performance dashboard. It is designed for traders who want to clearly evaluate breakout performance directly on the chart.
🕑 ORB Window Configuration
🔹 Session selection: choose between Market Timezone or Custom Session.
🔹 Timezone support: configurable from UTC-8 to UTC+12.
🔹 Daily limit: option to allow only one trade per day.
🔹 Risk/Reward (RR) settings:
Configurable TP1, TP2, and TP3 levels.
Stop Loss calculated dynamically from the ORB range.
📊 Backtesting Engine
🔹 Interactive dashboard showing trades, wins, losses, and win rate.
🔹 Adjustable partial exits for each TP (TP1, TP2, TP3).
🔹 Automatic calculation of percentage-based profit and loss.
🔹 Tracks total trades, total profit, and average profit per trade.
🎨 Visual Customization
🔹 Fully customizable colors:
ORB high/low lines and range fill.
Buy/Sell entry labels.
TP and SL lines with background zones.
🔹 Line style and thickness options (solid, dotted, dashed).
🔹 Visibility controls for each TP/SL level.
🔹 Clear profit and loss zones drawn directly on the chart.
🚀 Trading Logic
🔹 LONG entries: triggered when price breaks above the ORB high.
🔹 SHORT entries: triggered when price breaks below the ORB low.
🔹 Automatic calculation of Stop Loss and TP1, TP2, TP3 based on ORB range and RR.
🔹 Customizable BUY / SELL labels displayed at entry.
✅ TP / SL Detection
🔹 Real-time detection of TP1, TP2, TP3, and SL hits.
🔹 Prevents double counting of the same level.
🔹 Extended TP/SL lines with shaded zones for better clarity.
📈 Backtesting Dashboard
🔹 Displayed in the top-right corner of the chart.
🔹 Shows:
Total trades
Wins / Losses
Win rate (%)
Total profit (%)
Average profit per trade
🔹 Fully customizable panel color.
✨ Summary
This script combines:
Opening Range detection
Breakout trading logic with advanced risk management
Professional-grade visualizations
Integrated historical performance tracking
High customization for sessions, styles, and colors
💡 Ideal for traders who want to trade ORB setups with clarity, structure, and measurable results.

RSI+Breadth Multi-Factor# RSI+ Breadth Multi-Factor Indicator
**Multi-factor scoring system for US market timing | 美股多因子择时评分系统**
[! (img.shields.io)](www.tradingview.com)
[! (img.shields.io)](www.tradingview.com)
[! (img.shields.io)](LICENSE)
---
## Overview | 概述
A quantitative indicator that combines **RSI**, **market breadth** (% above 20/50-day MA), and **up/down volume ratio** to generate actionable buy/sell signals for SPY, QQQ, and IWM.
这是一个结合 **RSI**、**市场广度**(站上20/50日均线比例)和 **涨跌成交量比** 的量化指标,为 SPY、QQQ 和 IWM 生成可操作的买卖信号。
---
## Features | 功能特点
| Feature | 功能 |
|---------|------|
| 🎯 Multi-factor scoring (-10 to +10) | 多因子评分系统 (-10 到 +10) |
| 📊 RSI + Breadth + Volume integration | RSI + 广度 + 成交量三重验证 |
| 🔀 Three markets: SPY, QQQ, IWM | 三大市场:SPY、QQQ、IWM |
| 🔥 Cross-market resonance detection | 跨市场共振信号检测 |
| 📈 Trend filter (MA-based) | 趋势过滤(均线判断) |
| ⏰ Auto-adapts to intraday timeframes | 自动适配日内时间周期 |
| 🎚️ Three modes: Aggressive/Standard/Conservative | 三种模式:激进/标准/保守 |
---
## Signal Reference | 信号说明
| Score | Emoji | Signal | 中文 | Action |
|:-----:|:-----:|--------|:----:|--------|
| ≥ 6 | 🚀 | **PANIC LOW** | 恐慌低点 | Strong buy 强烈买入 |
| ≥ 4 | 📈 | **BUY ZONE** | 低吸区 | Accumulate 分批建仓 |
| -3~3 | - | **HOLD** | 持有 | Hold position 持仓观望 |
| ≤ -4↑ | ⭐ | **ELEVATED** | 高估 | Hold cautious 持有但谨慎 |
| ≤ -4↓ | ⚡ | **CAUTION** | 观望 | Take profit 止盈 |
| ≤ -6↓ | ⚠️ | **REDUCE** | 减仓 | Reduce position 减少仓位 |
> **↑ = Uptrend** (price > MA) | **↓ = Downtrend** (price < MA)
### Resonance Signals | 共振信号
| Emoji | Signal | Description |
|:-----:|--------|-------------|
| 🔥 | Resonance Buy | Multiple markets in buy zone 多市场同时低吸 |
| ❄️ | Resonance Risk | Multiple markets in risk zone 多市场同时高估 |
---
## Scoring Logic | 评分逻辑
### Factors | 因子
| Factor | Weight | Buy Score | Sell Score |
|--------|--------|-----------|------------|
| **RSI** | 1x | RSI < 30 → +2, < 40 → +1 | RSI > 75 → -2, > 65 → -1 |
| **FI (50D MA%)** | Bottom focus | < 25% → +3, < 35% → +2 | > 85% → -2, > 78% → -1 |
| **TW (20D MA%)** | Top focus | < 30% → +1 | > 82% → -3, > 72% → -2 |
| **Volume Ratio** | 1x | UVOL/DVOL < 0.5 → +2 | > 2.5 → -2 |
### Breadth Symbols | 广度数据
| Market | TW Symbol | FI Symbol | Volume |
|--------|-----------|-----------|--------|
| SPY (S&P 500) | INDEX:S5TW | INDEX:S5FI | USI:UVOL/DVOL |
| QQQ (NASDAQ) | INDEX:NCTW | INDEX:NCFI | USI:UVOLQ/DVOLQ |
| IWM (Russell 2000) | INDEX:R2TW | INDEX:R2FI | USI:UVOL/DVOL |
---
## Settings | 设置说明
### Mode | 模式
- **Aggressive**: Lower thresholds, shorter cooldown (5 bars)
- **Standard**: Balanced defaults (10 bar cooldown)
- **Conservative**: Higher thresholds, longer cooldown (15 bars)
### Key Parameters | 关键参数
| Parameter | Default | Description |
|-----------|---------|-------------|
| RSI Length | 14 | RSI calculation period |
| Trend MA Length | 10 | MA for trend filter |
| Cooldown Bars | 10 | Min bars between same signals |
| Resonance Window | 3 | Bars to check for multi-market agreement |
| Min Markets | 2 | # of markets needed for resonance |
---
## Usage | 使用方法
### Installation | 安装
1. Copy the indicator code
2. In TradingView: **Pine Editor** → **New** → Paste code → **Add to Chart**
### Recommended Setup | 推荐设置
- **Timeframe**: Daily (D) for best accuracy | 推荐日线图
- **Markets**: Apply on SPY, QQQ, or IWM | 应用于SPY/QQQ/IWM
- **Mode**: Start with "Standard" | 建议从"标准"模式开始
### Intraday Mode | 日内模式
The indicator automatically detects intraday timeframes and adjusts:
- Uses only RSI + Volume factors (TW/FI are daily-only data)
- Lowers signal thresholds accordingly
指标会自动检测日内周期并调整:
- 仅使用 RSI + 成交量因子(TW/FI 仅有日线数据)
- 相应降低信号触发阈值
---
## Dashboard | 仪表盘
Displays real-time factor breakdown:
```
┌────────┬───────┬────────┐
│ Factor │ Score │ Weight │
├────────┼───────┼────────┤
│ RSI │ 1.0 │ 1x │
│ FI(50D)│ 2.0 │ Bottom │
│ TW(20D)│ -1.0 │ Top │
│ Vol │ 1.0 │ 1x │
│ Trend │ ↑ │ 10MA │
├────────┼───────┼────────┤
│ Total │ 3.0 │ HOLD │
└────────┴───────┴────────┘
```
---
## Alerts | 警报
Available alerts for each market (SPY/QQQ/IWM):
- Panic Low / Buy Zone (entry signals)
- Reduce / Caution (exit signals)
- Resonance Buy / Risk (cross-market confirmation)
每个市场(SPY/QQQ/IWM)可设置以下警报:
- 恐慌低点 / 低吸区(入场信号)
- 减仓 / 观望(出场信号)
- 共振买入 / 风险(跨市场确认)
---
## Trend Filter | 趋势过滤
**Key feature**: Risk signals (CAUTION/REDUCE) only trigger when **price is below the trend MA**.
When price is above MA (uptrend), the indicator shows **ELEVATED** ⭐ instead, preventing premature exits during strong rallies.
**核心功能**:风险信号(观望/减仓)仅在 **价格跌破趋势均线** 时触发。
当价格在均线之上(上升趋势)时,指标显示 **高估** ⭐,避免在强势上涨中过早离场。
---
## Disclaimer | 免责声明
This indicator is for **educational and informational purposes only**. It is not financial advice. Past performance does not guarantee future results. Always do your own research and consider your risk tolerance before trading.
本指标仅供 **教育和参考用途**,不构成投资建议。历史表现不代表未来收益。交易前请自行研究并考虑风险承受能力。
---
## License | 许可
MIT License - Free to use and modify with attribution.
MIT 许可证 - 可自由使用和修改,请注明出处。
---
## Author | 作者
Built with ❤️ for the trading community.
为交易社区精心打造 ❤️

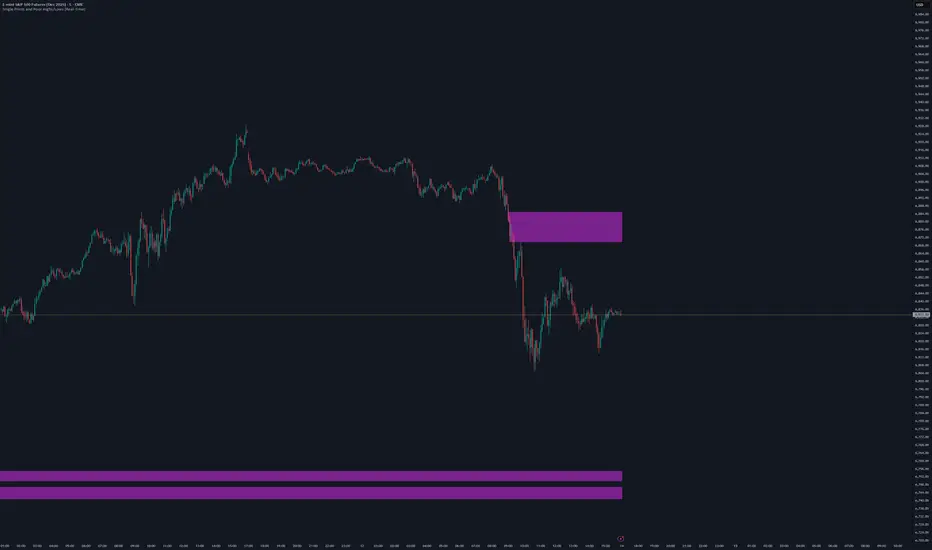
Single Prints and Poor Highs/Lows [Real-Time]This indicator is designed for traders utilizing Auction Market Theory (AMT) who need real-time visibility into market structure inefficiencies. Unlike standard TPO tools that often wait for closed bars or finished sessions, this script builds a developing TPO profile tick-by-tick to identify Single Prints and Poor Highs/Lows the moment they form.
Key Features:
Real-Time Single Prints: Automatically detects and highlights areas of single-print inefficiencies (buying/selling tails) as they happen. These "ghost" boxes persist on the chart until price repairs (fills) them, acting as immediate targets or support/resistance zones.
Poor High/Low Detection: Strictly implements AMT logic to identify "unfinished" auctions. If a session extreme is formed by two or more TPO blocks (indicating a flat top/bottom rather than a rejection tail), it marks the level with a dotted line.
Repair Logic: Both Single Prints and Poor High/Low lines are dynamic. If price revisits and repairs the structure, the markers automatically vanish to keep your chart clean.
Session Control: Fully customizable RTH (Regular Trading Hours) session input (default 08:30–15:15) to ensure profiles are built on relevant liquidity.
Quantization: Adjustable "Ticks per Block" allowing you to tune the sensitivity of the TPO profile to different assets (ES, NQ, CL, etc.).
How It Works:
TPO Construction: The script breaks the session into 30-minute periods (configurable) and tracks price overlap.
Single Prints: When the market expands rapidly, leaving gaps in the profile (single TPO blocks), a box is drawn. If price trades back through this box, it deletes itself.
Poor Extremes: It monitors the current session High and Low. If the extreme price level has a TPO count of ≥ 2, it is flagged as "Poor." If the extreme is a single print (count = 1), it is considered a valid tail and left unmarked.
Settings:
RTH Session: Define your specific trading session time.
TPO Period: Default is 30 minutes (standard AMT).
Ticks per Block: Controls the vertical resolution of the TPO. (Higher values = coarser profile, Lower values = more precision).
Colors: Fully customizable colors for Live Prints, Historical Prints, and Poor High/Low lines.
Usage:
Use this tool to spot immediate structural targets. A Poor High often acts as a magnet for price to revisit and "repair," while Single Prints often defend as support/resistance on the first retest.
EMA COLOR BUY SELL
indicator("Sorunsuz EMA Renk + AL/SAT", overlay=true)
length = input.int(20, "EMA Periyodu")
src = input.source(close, "Kaynak")
emaVal = ta.ema(src, length)
isUp = emaVal > emaVal
emaCol = isUp ? color.green : color.red
plot(emaVal, "EMA", color=emaCol, linewidth=2)
buy = isUp and not isUp // kırmızı → yeşil
sell = not isUp and isUp // yeşil → kırmızı
plotshape(buy, style=shape.arrowup, location=location.belowbar, color=color.green, size=size.large, text="AL")
plotshape(sell, style=shape.arrowdown, location=location.abovebar, color=color.red, size=size.large, text="SAT")
alertcondition(buy, "EMA AL", "EMA yukarı döndü")
alertcondition(sell, "EMA SAT", "EMA aşağı döndü")

Ripster Clouds + Saty Pivot + RVOL + Trend1. Ripster EMA Clouds (local + higher timeframe)
Local timeframe (your chart TF):
Plots up to 5 EMA clouds (8/9, 5/12, 34/50, 72/89, 180/200 – configurable).
Each cloud is:
One short EMA and one long EMA.
A filled band between them.
Color logic:
Cloud is bullish when short EMA > long EMA (green/blue-ish tone).
Bearish when short EMA < long EMA (red/orange/pink tone).
You can choose:
EMA vs SMA,
Whether to show the lines,
Per-cloud toggles.
MTF Clouds:
Two higher-timeframe EMA clouds:
Cloud 1: 50/55
Cloud 2: 20/21
Computed on a higher TF (default D, but configurable).
Show as thin lines + transparent bands.
Used for:
Visual higher-TF trend,
Optional signal filter (MTF must agree for trades).
2. Saty Pivot Ribbon (time-warped EMAs)
This is basically your Saty Pivot Ribbon integrated:
Uses a “Time Warp” setting to overlay EMAs from another timeframe.
EMAs:
Fast, Pivot, Slow (defaults 8 / 21 / 34).
Clouds:
Fast cloud between fast & pivot EMAs.
Slow cloud between pivot & slow EMAs.
Bullish/bearish colors are distinct from Ripster colors.
Optional highlights:
Can highlight fast/pivot/slow lines separately.
Conviction EMAs:
13 and 48 EMAs (configurable).
When fast conviction EMA crosses over/under slow:
You get triangle arrows (bullish/bearish conviction).
Bias candles:
If enabled, candles are recolored based on:
Price vs Bias EMA,
Candle up/down/doji,
So you see bullish/bearish “bias” directly in candle colors.
3. DTR vs ATR panel (range vs average)
In a small table panel (bottom-center by default):
Computes higher-TF ATR (default 14, TF auto D/W/M, smoothing type selectable).
Measures current range (high–low) on that TF.
Displays:
DTR: X vs ATR: Y Z% (+/-Δ% vs prev)
Where:
Z% = current range / ATR * 100.
Δ% = change vs previous bar’s Z%.
Background color:
Greenish for low move (<≈70%),
Red for high move (≥≈90%),
Yellow in between,
Slightly dimmed when price is below bias EMA.
This tells you: “Is today an average, quiet, or explosive day compared to normal?”
4. SMA Divergence panel
Separate histogram & line panel:
Fast and slow SMAs (default 14 & 30).
Computes price divergence vs SMA in %:
% above/below slow SMA,
% above/below fast SMA.
Shows:
Slow SMA divergence as a semi-transparent column,
Fast SMA divergence as a solid column on top,
EMA of the slow divergence (trend line) colored:
Blue when rising,
Orange/red when falling.
Static upper/lower bands with fill, plus optional zero line.
This gives you a feel for how stretched price is vs its anchors.
5. RVOL table (relative volume)
Small 3×2 table (bottom-right by default):
Inputs:
Average length (default 50 bars),
Optionally show previous candle RVOL.
Calculates:
RVOL now = volume / avg(volume N bars) * 100,
RVOL prev,
RVOL momentum (now – prev) for data window only.
Table columns:
Candle Vol,
RVOL (Now),
RVOL (Prev).
Colors:
200% → “high RVOL” color,
100–200% → “medium RVOL” color,
<100% → “low RVOL” color,
Slightly dimmer if price is below bias EMA.
This is used both visually and optionally as a signal filter (e.g., only trade when RVOL ≥ threshold).
6. Trend Dashboard (Price + 34/50 + 5/12)
Top-right trend box with 3 rows:
Price Action row:
Uses either Bias EMA or custom EMA on close to say:
Bullish (close > trend EMA),
Bearish (close < trend EMA),
Flat.
Ripster 34/50 Cloud row:
Uses 34/50 EMAs: bullish if 34>50, bearish if 34<50.
Ripster 5/12 Cloud row:
Uses 5/12 EMAs: bullish if 5>12, bearish if 5<12.
Then it does a vote:
Counts bullish votes (Price, 34/50, 5/12),
Counts bearish votes,
Depending on mode:
Majority (2 of 3) or Strict (3 of 3).
Output:
Overall Bullish / Bearish / Sideways.
You also get an optional label on the chart like
Overall: Bullish trend with color, and an optional background tint (green/red for bull/bear).
7. VWAP + Buy/Sell Signals
VWAP is plotted as a white line.
Fast “trend” cloud mid: average of 5 & 12 EMAs.
Slow “trend” cloud mid: average of 34 & 50 EMAs.
Buy condition:
5/12 crosses above 34/50 (bullish cloud flip),
Price > VWAP,
Optional filter: MTF Cloud 1 bullish (50/55 on higher TF),
Optional filter: RVOL >= threshold.
Sell condition:
5/12 crosses below 34/50,
Price < VWAP,
Optional same filters but bearish.
When conditions are met:
Plots BUY triangle up below price (distinct teal/green tone).
Plots SELL triangle down above price (distinct magenta/orange tone).
Alert conditions are defined for:
BUY / SELL signals,
Overall Bullish / Bearish / Sideways change,
MTF Cloud 1 trend flips.
8. Data Window metrics
For easy backtesting / inspection via TradingView’s data window, it exposes:
DTR% (Current) and DTR% Momentum,
RVOL% (Now), RVOL% (Prev), RVOL% Momentum.
TL;DR – What does this script do for you?
It turns your chart into a multi-framework trend and momentum dashboard:
Ripster EMA clouds for short/medium trend & S/R.
Saty Ribbon for higher-TF pivot structure and conviction.
RVOL + DTR/ATR for context (is this a big and well-participated move?).
SMA divergence panel for overextension/stretch.
A compact trend table that tells you Price vs 34/50 vs 5/12 in one glance.
Buy/Sell markers + alerts when:
short-term Ripster trend (5/12) flips over/under medium (34/50),
price agrees with VWAP,
plus optional filters (MTF trend and / or RVOL).
Basically: it’s a trend + confirmation + context system wrapped into one indicator, with most knobs configurable in the settings.

Opening Range Breakout with VWAP & RSI ConfirmationThis indicator identifies breakout trading opportunities based on the Opening Range Breakout (ORB) strategy combined with intraday VWAP and higher timeframe RSI confirmation.
Opening Range: Calculates the high, low, and midpoint of the first 15 or 30 minutes (configurable) after your specified market open time.
Intraday VWAP: A volume-weighted average price calculated manually and reset daily, tracking price action throughout the trading day.
RSI Confirmation: Uses RSI from a user-selected higher timeframe (1H, 4H, or Daily) to confirm signals.
Buy Signal: Triggered when VWAP breaks above the Opening Range High AND the RSI is below or equal to the buy threshold (default 30).
Sell Signal: Triggered when VWAP breaks below the Opening Range Low AND the RSI is above or equal to the sell threshold (default 70).
Visuals: Plots Opening Range levels and VWAP on the chart with clear buy/sell markers and optional labels showing RSI values.
Alerts: Provides alert conditions for buy and sell signals to facilitate timely trading decisions.
This tool helps traders capture momentum breakouts while filtering trades based on momentum strength indicated by RSI.

Liquidity Entry Triggers (4-Model System) | WarRoomXYZLiquidity Entry Triggers is an open-source, price-action-based analytical framework designed to highlight recurring institutional liquidity behaviors that appear across all liquid markets.
The script focuses on how and where liquidity is taken, rather than attempting to predict direction using oscillators or lagging indicators.
It is optimized for XAUUSD, FX pairs, indices, and crypto , particularly on 1m–15m timeframes where session behavior and liquidity reactions are most visible.
This tool is not a buy/sell signal generator .
It provides contextual entry zones based on structural liquidity logic, allowing traders to apply their own execution rules.
Core Philosophy
Markets move because of:
•Trapped traders
•Forced liquidations
•Session-based liquidity cycles
•Reactions at prior institutional participation zones
This script visualizes four repeatable entry triggers that emerge from those mechanisms.
🔹 1. Failed Breakout / Trapped Trader Model
When price breaks a clearly defined range high or low, breakout traders often enter expecting continuation.
If price fails to hold outside the range and closes back inside, those traders become trapped.
The script detects:
•Breaks beyond recent highs/lows
•Immediate rejection back into the range
•Structural failure of momentum
These conditions frequently lead to mean reversion or reversal moves as trapped traders exit and fuel movement in the opposite direction.
Markers are plotted at the point of failure to highlight potential trap zones.
🔹 2. Liquidation Flush Detection
Sharp impulsive candles with abnormally large wicks often represent liquidation cascades rather than healthy trend continuation.
The script identifies liquidation behavior by measuring:
•Wick-to-body imbalance
•Sudden expansion followed by rejection
•Temporary price inefficiencies
These flushes commonly occur near:
•Session highs/lows
•Range extremes
•Trend exhaustion points
Such events often lead to rebalance moves , where price partially or fully fills the wick.
🔹 3. Orderblock Reaction Zones
Orderblocks represent areas where heavy participation occurred before a strong displacement move.
The script highlights:
•Clean bullish and bearish orderblock structures
•Zones formed during consolidation prior to expansion
•Areas likely to be defended when revisited
Orderblocks with minimal noise and clean departure are prioritized, as they often reflect institutional positioning rather than retail activity.
These zones are intended as reaction areas , not automatic entry signals.
🔹 4. London Session Liquidity Sweep Model
The London session frequently establishes the initial daily high or low.
Later in the session or during New York, price often:
•Sweeps internal liquidity around that level
•Rejects after the sweep
•Continues with the higher-timeframe bias
The script monitors London session behavior and marks:
•Liquidity runs above/below London highs and lows
•Rejections back inside the prior structure
This model is especially effective when combined with broader daily context.
🔹4. How the Components Work Together
The framework is designed as a context stack , not a checklist of signals:
Liquidity Event → Location → Timing → Trader Execution
Each model reinforces the others:
•Failed breakouts often occur after liquidity sweeps
•Liquidation wicks frequently form near orderblocks
•London sweeps often trigger failed momentum moves
•Confluence increases probability, not certainty
🔹 Practical Usage Guide
✔ Identify context
Determine whether price is approaching a range extreme, session level, or prior participation zone.
✔ Wait for a liquidity event
Look for a sweep, failed breakout, or liquidation wick.
✔ Observe reaction
Rejection, displacement, or reclaim behavior provides confirmation.
✔ Execute manually
Stops are commonly placed beyond the liquidity extreme.
Targets are typically internal liquidity, prior highs/lows, or imbalance zones.
The indicator does not manage trades or enforce rules.
Execution and risk management remain the trader’s responsibility.
🔹 5. Originality & Design Notes
This script does not replicate or bundle existing indicators.
It introduces:
•A multi-model liquidity entry framework
•Structural failed breakout detection
•Wick-based liquidation imbalance logic
•Session-aware liquidity sweep visualization
•A unified, minimal, non-lagging design
All concepts are based on observable market behavior and integrated into a single analytical tool.
🔹 6. Suitable Markets & Timeframes
Works best on:
•XAUUSD
•Major FX pairs
•Indices
•Liquid crypto markets
Recommended timeframes:
•1m
•5m
•15m
•30m
🔹7. Limitations & Notes
•This is an analytical framework , not a trading system
•All markings are confirmed at candle close (non-repainting)
•No open interest or order flow data is used
•Results depend on user interpretation and execution
•Best used alongside session bias and higher-timeframe structure
Disclaimer
This script is provided for educational and informational purposes only.
It does not constitute financial advice, investment advice, or a recommendation to buy or sell any instrument.
Trading involves risk, and losses can exceed initial deposits.
The author assumes no responsibility for trading decisions made using this tool.
Users are strongly encouraged to test this script in demo or simulation environments and to apply proper risk management, position sizing, and personal discretion at all times.
By using this script, you acknowledge and accept all associated risks.

Scout Regiment - Signal📊 中文版
指标简介
Buy/Sell Signal 多维度交易信号指标
这是一个结合了EMA趋势过滤、CCI动量指标和RSI背景环境的多维度交易信号系统。通过三重过滤机制,帮助交易者在合适的市场环境中捕捉高质量的买卖信号。
核心特点
✅ 趋势过滤:使用233周期EMA确保顺势交易
✅ 动量确认:CCI(33)穿越信号作为入场触发
✅ 背景过滤:RSI(13)环境判断,避免同一背景重复信号
✅ 智能去重:每个RSI背景周期内只标记首次信号
✅ 清晰标识:三角形标记配合颜色区分买卖方向
使用说明
信号逻辑:
做多信号 (Buy):
收盘价 > EMA233(确认上升趋势)
CCI33向上穿越20(动量转强)
情况1:在RSI红色背景中首次出现
情况2:在RSI绿色背景中出现
做空信号 (Sell):
收盘价 < EMA233(确认下降趋势)
CCI33向下穿越80(动量转弱)
情况1:在RSI绿色背景中首次出现
情况2:在RSI红色背景中出现
参数设置
EMA过滤长度:默认233,用于判断主趋势方向
CCI长度:默认33,控制动量指标灵敏度
RSI长度:默认13,用于背景环境判断
重要提示
⚠️ 信号出现后不要立即下单!请务必检查:
CCI中期是否出现"浪子回头"形态
OBV成交量状态是否配合
RSI是否成功穿越50中线
结合其他技术分析工具综合判断
💡 建议配合使用:
支撑阻力位分析
成交量指标(如OBV)
更大周期的趋势确认
📈 English Version
Indicator Overview
Buy/Sell Signal - Multi-Dimensional Trading Signal System
This is a comprehensive trading signal system that combines EMA trend filtering, CCI momentum indicator, and RSI background environment. Through a triple-layer filtering mechanism, it helps traders capture high-quality buy and sell signals in appropriate market conditions.
Key Features
✅ Trend Filter: 233-period EMA ensures trend-following trades
✅ Momentum Confirmation: CCI(33) crossover signals as entry triggers
✅ Background Filter: RSI(13) environment detection to avoid duplicate signals
✅ Smart Deduplication: Only first signal per RSI background cycle
✅ Clear Visualization: Triangle markers with color-coded direction
How to Use
Signal Logic:
Buy Signal:
Close > EMA233 (confirms uptrend)
CCI33 crosses above 20 (momentum strengthens)
Case 1: First occurrence in RSI red background
Case 2: Occurs in RSI green background
Sell Signal:
Close < EMA233 (confirms downtrend)
CCI33 crosses below 80 (momentum weakens)
Case 1: First occurrence in RSI green background
Case 2: Occurs in RSI red background
Parameter Settings
EMA Filter Length: Default 233, for main trend direction
CCI Length: Default 33, controls momentum sensitivity
RSI Length: Default 13, for background environment detection
Important Notes
⚠️ DO NOT enter trades immediately after signal appears! Always check:
Whether CCI shows a "reversal" pattern in medium-term
OBV volume status confirmation
Whether RSI successfully crosses the 50 midline
Combine with other technical analysis tools
💡 Recommended to Use With:
Support/Resistance analysis
Volume indicators (such as OBV)
Higher timeframe trend confirmation
Risk Disclaimer
This indicator is for reference only and does not constitute investment advice. Trading involves risk. Please conduct thorough analysis and use proper risk management before making any trading decisions.
适合交易者类型 / Suitable For:
波段交易者 / Swing Traders
日内交易者 / Day Traders
趋势跟踪者 / Trend Followers
适用市场 / Applicable Markets:
股票 / Stocks
外汇 / Forex
加密货币 / Crypto
期货 / Futures

Bassi MA Entry Helper MTF EMA , VWMA Swing , ADX , SMA200 , TPBassi MA Entry Helper is an advanced multi-timeframe confluence system designed to identify high-probability entries using trend, volume, market structure, and volatility filters.
It is built for traders who want cleaner signals, fewer false entries, and strong multi-confirmation setups.
Key Features
Multi-Timeframe EMA Crossovers – HTF signal engine
SMA200 Trend Filter – prevents counter-trend trades
VWMA Swing Confirmation – volume-validated micro-swings
ADX Filter – only trade when the trend has strength
Fractal Structure Mapping – identifies swing highs/lows
Retracement Filter – confirms pullbacks before entries
TP/SL Automation – ATR or percentage based
Clean Entry Labels – main & additional entry signals
Highly Customizable – mode, timeframe, filters, visuals
This script is ideal for:
Scalping • Intraday • Swing • Trend continuation • Volume-based setups • Multi-timeframe alignment
How It Works
Main Buy/Sell Signals
Triggered when:
✔ Fast EMA crosses Slow EMA (HTF)
✔ Price aligned with trend
✔ SMA200 filter valid
✔ VWMA confirmation (optional)
✔ ADX strong
✔ Retracement valid (optional)
Additional Buy/Sell Signals
Triggered when VWMA crosses Slow EMA during trend continuation.
TP/SL System
You can choose between:
%-based take-profit & stop-loss
ATR-based dynamic levels
Automatically projects clean visual levels on your chart.
Notes
This indicator does not repaint and is suitable for both real-time and historical analysis.
Always combine signals with proper risk management.
Initial Release – v1.0
Added multi-timeframe EMA engine
Added SMA200 trend filter
Added VWMA swing entries
Added ADX strength filter
Added retracement filter
Added fractal swing detection
Added TP/SL auto plotting
Added main & additional entry labels
Performance optimized

Open Range BreakoutOpen Range Breakout (ORB)
The Open Range Breakout (ORB) is a classic intraday strategy used across stocks, indices, FX and futures. It focuses on how price behaves during the first minutes of a major session, when liquidity and volatility are highest.
This indicator fully automates the ORB process with session detection, box drawing, breakout & retest logic, and final Buy/Sell signals.
Multi-Session Support
Choose between the three most important global opens:
Asia (Tokyo) – JPY pairs, Asian indices, gold, crypto
London – FX majors, European indices, strong volatility
New York – US indices, USD pairs, gold, oil, highest volume
The Opening Range is calculated only during the selected session.
ORB Range (5 / 15 / 30 min)
The indicator builds the ORB High/Low from the first X minutes of the session, draws the box, and waits for price action once the range is complete.
How It Works
ORB Window → High/Low of the opening minutes are recorded.
Breakout → Price closes above/below the ORB → “BREAKOUT” label.
Retest → Price returns to the ORB box → “RETEST” label.
Confirmation Levels Freeze → Upper/lower structure set.
Final Signal
Close above frozen upper level → BUY
Close below frozen lower level → SELL
This filters out false breakouts and provides structured continuation signals.
Alerts
Includes built-in alert conditions for:
ORB BUY Signal
ORB SELL Signal
Alerts trigger exactly when the Buy or Sell label appears.
Works On
Stocks & indices
Forex
Futures

Rahul Prakash's BUY/SELL signal for momentum tradeBuy or Sell signal with just on one confirmation candle.
Show a Buy singal then wait for the confirmation candle, is a strong Buy signal.
Show a Sell singal then wait for the confirmation candle, is a strong Sell signal.
You can use as a free version and earn money. Please are taking lots of price for this type of indicator.

9 EMA Retracement Buy/Sell + Volume FilterFor all you scalpers out there this is a 9 ema scalp Indicator coupled with volume bars, the Indicator plots buy and sell when the conditions are met
Price mist be above or below the 9 ema it must retrace and the volume bar must match the direction of the candle and then a signal will be printed with a red or green triangle, do not blindly take all trades on the signals make sure the is a trend works on any asset and remember it is for scalping only

Fractal Fade Pro IndicatorA revolutionary contrarian trading indicator that applies chaos theory, fractal mathematics, and market entropy to generate high-probability reverse signals. This indicator fades traditional technical signals, providing BUY signals when conventional indicators say SELL, and SELL signals when they say BUY.
Full Description:
Most traders follow the herd. QFCI does the opposite. It identifies when conventional technical analysis is about to fail by detecting mathematical patterns of exhaustion in market structure.
How It Works (Technical Overview):
The indicator combines three sophisticated mathematical approaches:
Fractal Dimension Analysis: Measures the "roughness" of price movements using fractal mathematics
Market Entropy Calculation: Quantifies the randomness and disorder in price returns using information theory
Phase Space Reconstruction: Analyzes price evolution in multi-dimensional state space from chaos theory
Signal Generation Process:
Step 1: Market Regime Detection
Chaotic Regime: High fractal complexity + rising entropy (avoid trading)
Trending Regime: Low fractal complexity + high phase space distance (fade breakouts)
Mean-Reverting Regime: Very low fractal complexity (fade extremes)
Step 2: Reverse Signal Logic
When traditional indicators would give:
BUY signal (breakout, oversold bounce, volatility spike) → QFCI shows SELL
SELL signal (breakdown, overbought rejection, volatility crash) → QFCI shows BUY
Step 3: Smart Signal Filtering
No consecutive same-direction signals
Adjustable minimum bars between signals
Multiple confirmation layers required
Unique Features:
1. Mathematical Innovation:
Original fractal dimension algorithm (not standard indicators)
Market entropy calculation from information theory
Phase space reconstruction from chaos theory
Multi-regime adaptive logic
2. Trading Psychology Advantage:
Contrarian by design - profits from market overreactions
Fades retail trader mistakes - enters when others are exiting
Reduces overtrading - strict signal frequency controls
3. Clean Visual Interface:
Only BUY/SELL labels - no chart clutter
Clear directional arrows - immediate signal recognition
Built-in alerts - never miss a trade
Recommended Settings:
Default (Balanced Approach):
Fractal Depth: 20
Entropy Period: 200
Min Bars Between Signals: 100
Aggressive Trading:
Fractal Depth: 10-15
Entropy Period: 100-150
Min Bars Between Signals: 50-75
Conservative Trading:
Fractal Depth: 30-40
Entropy Period: 300-400
Min Bars Between Signals: 150-200
Optimal Timeframes:
Primary: Daily, Weekly (best performance)
Secondary: 4-Hour, 12-Hour
Can work on: 1-Hour (with adjusted parameters)
How to Use:
For Beginners:
Apply indicator to chart
Use default settings
Wait for BUY/SELL labels
Enter on next candle open
Use 2:1 risk/reward ratio
Always use stop losses
For Advanced Traders:
Adjust parameters for your trading style
Combine with support/resistance levels
Use volume confirmation
Scale in/out of positions
Track performance by regime
Risk Management Guidelines:
Position Sizing:
Conservative: 1-2% risk per trade
Moderate: 2-3% risk per trade
Aggressive: 3-5% risk per trade (not recommended)
Stop Loss Placement:
BUY signals: Below recent swing low or -2x ATR
SELL signals: Above recent swing high or +2x ATR
Take Profit Targets:
Primary: 2x risk (minimum)
Secondary: Previous support/resistance
Tertiary: Trailing stops after 1.5x risk
IMPORTANT RISK DISCLOSURE
This indicator is for educational and informational purposes only. It is not financial advice. Past performance does not guarantee future results. Trading involves substantial risk of loss and is not suitable for every investor. The risk of loss in trading can be substantial. You should therefore carefully consider whether such trading is suitable for you in light of your financial condition.

Wp's Vector CandlesVector Candles are special, color-coded candlesticks that highlight significant market activity, showing intense buying/selling (climax), institutional entry, momentum shifts, or potential reversals by analyzing high volume and large price ranges (spreads). They transform normal charts to instantly spot areas of extreme participation (bullish green/blue, bearish red/violet) versus standard conditions (gray), helping traders see market dynamics beyond just price.

Session Sweep System – WarRoomXYZ V1WarRoom Session Sweep System v1 is a open-source institutional trading framework built to identify liquidity behavior across Asia, London, and New York sessions.
It combines session-based liquidity mapping, sweep detection, daily expansion modeling, and trend confirmation into a unified, timing-driven system optimized for XAUUSD, FX pairs, indices, and any instrument with session-dependent volatility.
This tool does not attempt to predict direction with arbitrary oscillators.
Instead, it focuses on the underlying market mechanisms that drive price:
liquidity, timing, expansion, and trend alignment.
Below is a detailed explanation of what the script does, how its components work, and how traders can use it effectively.
🔹 1. Session Liquidity Mapping
The script automatically identifies the Asia (00:00–06:00 GMT), London (07:00–12:00 GMT), and New York (13:00–17:00 GMT) sessions and builds real-time session ranges.
Each session creates a liquidity pool.
Trading institutions frequently sweep the high or low of one session before delivering the real move in the next session.
This script captures that behavior by:
►Drawing session range boxes
►Tracking previous session highs/lows
►Highlighting high-probability sweep locations
These ranges are essential reference points for timing entries and exits.
🔹 2. Liquidity Sweep Detection (Buy & Sell Sweeps)
The indicator identifies when price runs a previous session high/low and rejects back inside the range, which is commonly interpreted as a liquidity sweep.
The following sweep types are monitored:
►London sweeping Asia
►New York sweeping London
►Asia sweeping New York
►Daily sweep of PDH/PDL
Sweeps signal that liquidity has been collected and that a potential reversal or continuation is likely.
These are marked clearly on the chart for real-time decision-making.
🔹 3. Killzone Timing Model (GMT Time)
Market manipulation and expansion often occur during specific time windows.
The script highlights these institutional killzones:
►London Killzone: 07:00–10:00 GMT
►New York Killzone: 13:30–15:30 GMT
►NY PM Session: 19:00–21:00 GMT
Sweeps occurring inside these windows carry a significantly higher probability.
The timing layer helps filter out low-quality setups.
🔹 4. Daily Range & ADR Expansion Engine
A dedicated panel displays:
►Current day range
►ADR (Average Daily Range)
►Expansion stage (Early / Developed / Extended)
►PDH/PDL swept or intact
►Overall session bias
This allows traders to understand whether the daily move is likely to continue or reverse.
For example:
►Early expansion → trend continuation likely
►Extended expansion → reversal setups become more probable
This is useful for intraday targets and risk management.
🔹 5. MA Cloud Trend Model (Fast/Slow Structure)
To align liquidity behavior with directional conviction, the script includes a configurable MA engine:
►Fast & slow MA
►MA cloud
►Slope-based trend coloring
►Trend background
►MA cross alerts
The cloud provides trend confirmation without relying on oscillators.
Trades are higher quality when the sweep direction aligns with the MA trend.
🔹 6. How the Components Work Together
The script integrates several institutional concepts into one coherent model:
►Sessions define liquidity pools
►Sweeps identify stop-hunts and reversals
►Killzones define optimal timing
►MA Cloud confirms directional bias
►ADR engine indicates expansion potential
This creates a structured framework:
Sweep → Timing → Trend → Expansion → Execution
Each component strengthens the others, forming a robust decision-making model.
🔹 7. How to Use the Indicator (Practical Guide)
✔ Look for a sweep of a previous session level
When price runs a session high/low and closes back inside, liquidity has likely been collected.
✔ Confirm timing
Sweeps inside London or NY killzones tend to produce the strongest moves.
✔ Confirm trend
Use MA cloud direction and slope:
►Cloud green → long setups preferred
►Cloud red → short setups preferred
✔ Check ADR panel
If the day has already expanded significantly, reversal setups are more likely.
If expansion is still early, continuation setups are favored.
✔ Plan your trade
Common targets include:
►Opposite side of session range
►ADR High/Low
►PDH/PDL
Stops are typically placed beyond the sweep wick.
This creates a repeatable, rule-based approach to intraday liquidity trading.
🔹 8. Why This Script Is Original
This is not a mashup of existing open-source indicators.
It introduces:
►A custom session-linked liquidity sweep engine
►A structured daily expansion model
►Integrated killzone timing aligned with GMT
►A unified bias panel merging sweeps, ADR, and session manipulation
►A trend confirmation layer designed around session behavior
While it uses known institutional concepts, their integration, execution, and timing framework are unique, purpose-built, and not directly found in open-source scripts.
🔹 9. Suitable Markets
This indicator works best on:
►XAUUSD
►Major FX pairs
►US indices
►Synthetic markets with session cycles
Ideal timeframes: 1m, 5m, 15m, 30m
🔹 10. Limitations / Notes
This is an analytical tool, not a buy/sell signal generator
All sweeps are confirmed at candle close (non-repaint)
The tool assumes GMT session windows unless chart time differs
Users must practice risk management and entry triggers manually
Disclaimer
This script is provided for informational and educational purposes only. It does not provide financial, investment, or trading advice, and it does not guarantee profits or future performance. All decisions made based on this script are solely the responsibility of the user.
This script does not execute trades, manage risk, or replace the need for trader discretion. Market behavior can change quickly, and past behavior detected by the script does not ensure similar future outcomes.
Users should test the script on demo or simulation environments before applying it to live markets and must maintain full responsibility for their own risk management, position sizing, and trade execution.
Trading involves risk, and losses can exceed deposits. By using this script, you acknowledge that you understand and accept all associated risks.

VWAP-Anchored MACD [BOSWaves]VWAP-Anchored MACD - Volume-Weighted Momentum Mapping With Zero-Line Filtering
Overview
The VWAP-Anchored MACD delivers a refined momentum model built on volume-weighted price rather than raw closes, giving you a more grounded view of trend strength during sessions, weeks, or months.
Instead of tracking two EMAs of price like a standard MACD, this tool reconstructs the MACD engine using anchored VWAP as the core input. The result is a momentum structure that reacts to real liquidity flow, filters out weak crossovers near the zero line, and visualizes acceleration shifts with clear, high-contrast gradients.
This indicator acts as a precise momentum map that adapts in real time. You see how weighted price is accelerating, where valid crossovers form, and when trend conviction is strong enough to justify execution.
It uses gradient line coloring to show bullish or bearish momentum, histogram shading to highlight energy shifts, cross dots to mark valid crossovers, optional buy/sell diamonds for execution cues, and candle coloring to display trend strength at a glance.
Theoretical Foundation
Traditional MACD compares the difference between two exponential moving averages of price.
This variant replaces price with anchored VWAP, making the calculation sensitive to actual traded volume across your chosen period (Session, Week, or Month).
Three principles drive the logic:
Anchored VWAP Momentum : Price is weighted by volume and aggregated across the selected anchor. The fast and slow VWAP-EMAs then expose how liquidity-corrected momentum is expanding or contracting.
Zero-Line Distance Filtering : Crossover signals that occur too close to the zero line are removed. This eliminates the common MACD problem of generating weak, directionless signals in choppy phases.
Directional Visualization : MACD line, signal line, histogram, candle colors, and optional diamond markers all react to shifts in VWAP-momentum, giving you a clean structural read on market pressure.
Anchoring VWAP to session, weekly, or monthly resets creates a systematic framework for tracking how capital flow is driving momentum throughout each trading cycle.
How It Works
The core engine processes momentum through several mapped layers:
VWAP Aggregation : Price × volume is accumulated until the anchor resets. This creates a continuous, liquidity-corrected VWAP curve.
MACD Construction : Fast and slow VWAP-EMAs define the MACD line, while a smoothed signal line identifies edges where momentum shifts.
Zero-Line Distance Filter : MACD and signal must both exceed a threshold distance from zero for a crossover to count as valid. This prevents fake crossovers during compression.
Visual Momentum Layers : It uses gradient line coloring to show bullish or bearish momentum, histogram shading to highlight energy shifts, cross dots to mark valid crossovers, optional buy/sell diamonds for execution cues, and candle coloring to display trend strength at a glance.
This layered structure ensures you always know whether momentum is strengthening, fading, or transitioning.
Interpretation
You get a clean, structural understanding of VWAP-based momentum:
Bullish Phases : MACD > Signal, histogram expands, candles turn bullish, and crossovers occur above the threshold.
Bearish Phases : MACD < Signal, histogram drives lower, candles shift bearish, and downward crossovers trigger below the threshold.
Neutral/Compression : Both lines remain near the zero boundary, histogram flattens, and signals are suppressed to avoid noise.
This creates a more disciplined version of MACD momentum reading - less noise, more conviction, and better alignment with liquidity.
Strategy Integration
Trend Continuation : Use VWAP-MACD crossovers that occur far from the zero line as higher-conviction entries.
Zero-Line Rejection : Watch for histogram contractions near zero to anticipate flattening momentum and potential reversal setups.
Session/Week/Month Anchors : Session anchor works best for intraday flows. Weekly or monthly anchor structures create cleaner macro momentum reads for swing trading.
Signal-Only Execution : Optional buy/sell diamonds give you direct points to trigger trades without overanalyzing the chart.
This indicator slots cleanly into any momentum-following system and offers higher signal quality than classic MACD variants due to the volume-weighted core.
Technical Implementation Details
VWAP Reset Logic : Session (D), Week (W), or Month (M)
Dynamic Fast/Slow VWAP EMAs : Fully configurable lengths, smoothing and anchor settings
MACD/Signal Line Framework : Traditional structure with volume-anchored input
Zero-Line Filtering : Adjustable threshold for structural confirmation
Dual Visualization Layers : MACD body + histogram + crosses + candle coloring
Optimized Performance : Lightweight, fast rendering across all timeframes
Optimal Application Parameters
Timeframes:
1- 15 min : Short-term momentum scalping and rapid trend shifts
30- 240 min : Balanced momentum mapping with clear structural filtering
Daily : Macro VWAP regime identification
Suggested Configuration:
Fast Length : 12
Slow Length : 26
Signal Length : 9
Zero Threshold : 200 - 500 depending on asset range
These suggested parameters should be used as a baseline; their effectiveness depends on the asset volatility, liquidity, and preferred entry frequency, so fine-tuning is expected for optimal performance.
Performance Characteristics
High Effectiveness:
Assets with strong intraday or session-based volume cycles
Markets where volume-weighted momentum leads price swings
Trend environments with strong acceleration
Reduced Effectiveness:
Ultra-choppy markets hugging the VWAP axis
Sessions with abnormally low volume
Ranges where MACD naturally compresses
Disclaimer
The VWAP-Anchored MACD is a structural momentum tool designed to enhance directional clarity - not a guaranteed predictor. Performance depends on market regime, volatility, and disciplined execution. Use it alongside broader trend, volume, and structural analysis for optimal results.

5MA+スーパートレンド + Disparity Scalping (SIMPLE FILTER)5MA + ATR Trend Filter + Disparity Scalping
This indicator combines a five-EMA trend framework, an ATR-based trailing trend line, a volatility breakout detector, and an ultra-fast scalping module using RSI and custom momentum prediction.
It is designed for both trend continuation and rapid reversal trading.
🔹 Main Components
1️⃣ Five-EMA Trend Framework
Uses 9 / 20 / 50 / 100 / 200 EMAs
Identifies short-term and long-term market direction
Provides dynamic support and resistance
Helpful for determining breakout vs. pullback conditions
2️⃣ ATR-Based Trailing Trend Line
Uses ATR multiplier to build a trailing stop line
Color change indicates directional shift
Works as a trend filter or trailing stop reference
Helps avoid counter-trend trades during strong trends
3️⃣ High-Volatility Breakout Detector (Optimized for Fast Markets)
Uses ATR expansion, Bollinger band breakout, and volatility comparison (HV vs RV)
Detects sudden market acceleration
Generates breakout BUY/SELL signals when volatility pressure aligns with direction
Useful for explosive markets such as gold or crypto, but compatible with all assets
4️⃣ Ultra-Fast Disparity Scalper
Measures price distance from EMA5 and EMA10
Uses RSI for exhaustion filtering
Predicts momentum turns with a custom RVI-based algorithm
Generates early reversal BUY/SELL signals before full market reaction
Designed for scalping in high-speed environments
5️⃣ Simple Overheat Filter
Blocks trades in extremely overbought/oversold zones
Gray signals indicate low-quality trade setups to avoid
Helps remove “chasing” entries during excessive deviation
🎯 Best Use Cases
Scalping fast reversals
Entering trends after confirmed volatility breakouts
Filtering entries during extreme overbought/oversold phases
Combining EMA structure with breakout momentum
⚠️ Important Notice
This tool is designed to support decision making, not guarantee trade results.
For best performance, combine with:
Price action (market structure)
Volume/volatility context
Support and resistance analysis
🏷️ Short Description (for compact summary)
Five-EMA trend structure with ATR trailing filter, volatility breakout detection, and ultra-fast scalping using RSI + momentum prediction. Suitable for both rapid reversals and trend continuation setups.

Gyspy Bot Trade Engine - V1.2B - Alerts - 12-7-25 - SignalLynxGypsy Bot Trade Engine (MK6 V1.2B) - Alerts & Visualization
Brought to you by Signal Lynx | Automation for the Night-Shift Nation 🌙
1. Executive Summary & Architecture
Gypsy Bot (MK6 V1.2B) is not merely a strategy; it is a massive, modular Trade Engine built specifically for the TradingView Pine Script V6 environment. While most tools rely on a single dominant indicator to generate signals, Gypsy Bot functions as a sophisticated Consensus Algorithm.
Note: This is the Indicator / Alerts version of the engine. It is designed for visual analysis and generating live alert signals for automation. If you wish to see Backtest data (Equity Curves, Drawdown, Profit Factors), please use the Strategy version of this script.
The engine calculates data from up to 12 distinct Technical Analysis Modules simultaneously on every bar closing. It aggregates these signals into a "Vote Count" and only fires a signal plot when a user-defined threshold of concurring signals is met. This "Voting System" acts as a noise filter, requiring multiple independent mathematical models—ranging from volume flow and momentum to cyclical harmonics and trend strength—to agree on market direction.
Beyond entries, Gypsy Bot features a proprietary Risk Management suite called the Dump Protection Team (DPT). This logic layer operates independently of the entry modules, specifically scanning for "Moon" (Parabolic) or "Nuke" (Crash) volatility events to signal forced exits, preserving capital during Black Swan events.
2. ⚠️ The Philosophy of "Curve Fitting" (Must Read)
One must be careful when applying Gypsy Bot to new pairs or charts.
To be fully transparent: Gypsy Bot is, by definition, a very advanced curve-fitting engine. Because it grants the user granular control over 12 modules, dozens of thresholds, and specific voting requirements, it is extremely easy to "over-fit" the data. You can easily toggle switches until the charts look perfect in hindsight, only to have the signals fail in live markets because they were tuned to historical noise rather than market structure.
To use this engine successfully:
Visual Verification: Do not just look for "green arrows." Look for signals that occur at logical market structure points.
Stability: Ensure signals are not flickering. This script uses closed-candle logic for key decisions to ensure that once a signal plots, it remains painted.
Regular Maintenance is Mandatory: Markets shift regimes (e.g., from Bull Trend to Crab Range). Gypsy Bot settings should be reviewed and adjusted at regular intervals to ensure the voting logic remains aligned with current market volatility.
Timeframe Recommendations:
Gypsy Bot is optimized for High Time Frame (HTF) trend following. It generally produces the most reliable results on charts ranging from 1-Hour to 12-Hours, with the 4-Hour timeframe historically serving as the "sweet spot" for most major cryptocurrency assets.
3. The Voting Mechanism: How Entries Are Generated
The heart of the Gypsy Bot engine is the ActivateOrders input (found in the "Order Signal Modifier" settings).
The engine constantly monitors the output of all enabled Modules.
Long Votes: GoLongCount
Short Votes: GoShortCount
If you have 10 Modules enabled, and you set ActivateOrders to 7:
The engine will ONLY plot a Buy Signal if 7 or more modules return a valid "Buy" signal on the same closed candle.
If only 6 modules agree, the signal is rejected.
4. Technical Deep Dive: The 12 Modules
Gypsy Bot allows you to toggle the following modules On/Off individually to suit the asset you are trading.
Module 1: Modified Slope Angle (MSA)
Logic: Calculates the geometric angle of a moving average relative to the timeline.
Function: Filters out "lazy" trends. A trend is only considered valid if the slope exceeds a specific steepness threshold.
Module 2: Correlation Trend Indicator (CTI)
Logic: Measures how closely the current price action correlates to a straight line (a perfect trend).
Function: Ensures that we are moving up with high statistical correlation, reducing fake-outs.
Module 3: Ehlers Roofing Filter
Logic: A spectral filter combining High-Pass (trend removal) and Super Smoother (noise removal).
Function: Isolates the "Roof" of price action to catch cyclical turning points before standard moving averages.
Module 4: Forecast Oscillator
Logic: Uses Linear Regression forecasting to predict where price "should" be relative to where it is.
Function: Signals when the regression trend flips. Offers "Aggressive" and "Conservative" calculation modes.
Module 5: Chandelier ATR Stop
Logic: A volatility-based trend follower that hangs a "leash" (ATR multiple) from extremes.
Function: Used as an entry filter. If price is above the Chandelier line, the trend is Bullish.
Module 6: Crypto Market Breadth (CMB)
Logic: Pulls data from multiple major tickers (BTC, ETH, and Perpetual Contracts).
Function: Calculates "Market Health." If Bitcoin is rising but the rest of the market is dumping, this module can veto a trade.
Module 7: Directional Index Convergence (DIC)
Logic: Analyzes the convergence/divergence between Fast and Slow Directional Movement indices.
Function: Identifies when trend strength is expanding.
Module 8: Market Thrust Indicator (MTI)
Logic: A volume-weighted breadth indicator using Advance/Decline and Volume data.
Function: One of the most powerful modules. Confirms that price movement is supported by actual volume flow. Recommended setting: "SSMA" (Super Smoother).
Module 9: Simple Ichimoku Cloud
Logic: Traditional Japanese trend analysis.
Function: Checks for a "Kumo Breakout." Price must be fully above/below the Cloud to confirm entry.
Module 10: Simple Harmonic Oscillator
Logic: Analyzes harmonic wave properties to detect cyclical tops and bottoms.
Function: Serves as a counter-trend or early-reversal detector.
Module 11: HSRS Compression / Super AO
Logic: Detects volatility compression (HSRS) or Momentum/Trend confluence (Super AO).
Function: Great for catching explosive moves resulting from consolidation.
Module 12: Fisher Transform (MTF)
Logic: Converts price data into a Gaussian normal distribution.
Function: Identifies extreme price deviations. Uses Multi-Timeframe (MTF) logic to ensure you aren't trading against the major trend.
5. Global Inhibitors (The Veto Power)
Even if 12 out of 12 modules vote "Buy," Gypsy Bot performs a final safety check using Global Inhibitors.
Bitcoin Halving Logic: Prevents trading during chaotic weeks surrounding Halving events (dates projected through 2040).
Miner Capitulation: Uses Hash Rate Ribbons to identify bearish regimes when miners are shutting down.
ADX Filter: Prevents trading in "Flat/Choppy" markets (Low ADX).
CryptoCap Trend: Checks the total Crypto Market Cap chart for broad market alignment.
6. Risk Management & The Dump Protection Team (DPT)
Even in this Indicator version, the RM logic runs to generate Exit Signals.
Dump Protection Team (DPT): Detects "Nuke" (Crash) or "Moon" (Pump) volatility signatures. If triggered, it plots an immediate Exit Signal (Yellow Plot).
Advanced Adaptive Trailing Stop (AATS): Dynamically tightens stops in low volatility ("Dungeon") and loosens them in high volatility ("Penthouse").
Staged Take Profits: Plots TP1, TP2, and TP3 events on the chart for visual confirmation or partial exit alerts.
7. Recommended Setup Guide
When applying Gypsy Bot to a new chart, follow this sequence:
Set Timeframe: 4 Hours (4H).
Tune DPT: Adjust "Dump/Moon Protection" inputs first. These filter out bad signals during high volatility.
Tune Module 8 (MTI): Experiment with the MA Type (SSMA is recommended).
Select Modules: Enable/Disable modules based on the asset's personality (Trending vs. Ranging).
Voting Threshold: Adjust ActivateOrders to filter out noise.
Alert Setup: Once visually satisfied, use the "Any Alert Function Call" option when creating an alert in TradingView to capture all Buy/Sell/Close events generated by the engine.
8. Technical Specs
Engine Version: Pine Script V6
Repainting: This indicator uses Closed Candle data for all Risk Management and Entry decisions. This ensures that signals do not vanish after the candle closes.
Visuals:
Blue Plot: Buy/Sell Signal.
Yellow Plot: Risk Management (RM) / DPT Close Signal.
Green/Lime/Olive Plots: Take Profit hits.
Disclaimer:
This script is a complex algorithmic tool for market analysis. Past performance is not indicative of future results. Cryptocurrency trading involves substantial risk of loss. Use this tool to assist your own decision-making, not to replace it.
9. About Signal Lynx
Automation for the Night-Shift Nation 🌙
Signal Lynx focuses on helping traders and developers bridge the gap between indicator logic and real-world automation. The same RM engine you see here powers multiple internal systems and templates, including other public scripts like the Super-AO Strategy with Advanced Risk Management.
We provide this code open source under the Mozilla Public License 2.0 (MPL-2.0) to:
Demonstrate how Adaptive Logic and structured Risk Management can outperform static, one-layer indicators
Give Pine Script users a battle-tested RM backbone they can reuse, remix, and extend
If you are looking to automate your TradingView strategies, route signals to exchanges, or simply want safer, smarter strategy structures, please keep Signal Lynx in your search.
License: Mozilla Public License 2.0 (Open Source).
If you make beneficial modifications, please consider releasing them back to the community so everyone can benefit.

Box TheoryBox Theory – Description
This indicator is based on the popular “Box Theory” concept, where the previous session’s High–Low range acts as the most important structure for the next session.
Traders use this because the market often reacts to the same areas where liquidity, orders, and imbalances were created in the prior session.
At every new session open, the indicator automatically records:
Previous High
Previous Low
Middle (50% level)
These three levels form a box, which becomes your roadmap for the new session.
This method is widely used because it highlights where most reversals, sweeps, and reactions occur—without needing any extra indicators.
How the Zones Are Calculated
Previous High
The highest price of the last session.
This forms the top edge, which acts as resistance and the basis for the Sell Zone.
Previous Low
The lowest price of the last session.
This forms the bottom edge, acting as support and the basis for the Buy Zone.
Middle Line (50% Level)
The exact midpoint between High and Low.
This is the fair-value zone, where price often consolidates and becomes directionless.
No signals are triggered near the middle, because trades taken here historically have low accuracy.
Buy Zone (Green Area)
The lower part of the box.
Price often reacts here because this area held buyers in the previous session.
When price enters this green zone inside the box, the indicator can show a Buy Zone label.
Sell Zone (Red Area)
The upper part of the box.
Price commonly rejects here because this area acted as resistance previously.
When price enters this red zone inside the box, the indicator can show a Sell Zone label.
How Zone Size Is Set (Sensitivity %)
You can adjust how big the Buy/Sell zones are using the Sensitivity (%) input.
Lower % → Smaller zones → More precise signals
Higher % → Larger zones → Signals appear earlier and from farther away
Formula:
Zone Size = (Previous High − Previous Low) × (Sensitivity % ÷ 100)
This lets you customize how tight or how early your signals appear.
Inside-Box Only Logic
The indicator only works inside the previous session’s range.
If price breaks above the previous High → No sell signal
If price breaks below the previous Low → No buy signal
This avoids false signals during breakouts or trending markets.
Alerts
The indicator includes two alerts:
Buy Zone Alert → Triggers when price enters the Buy Zone
Sell Zone Alert → Triggers when price enters the Sell Zone
Just enable them in TradingView’s alert panel.
